Description
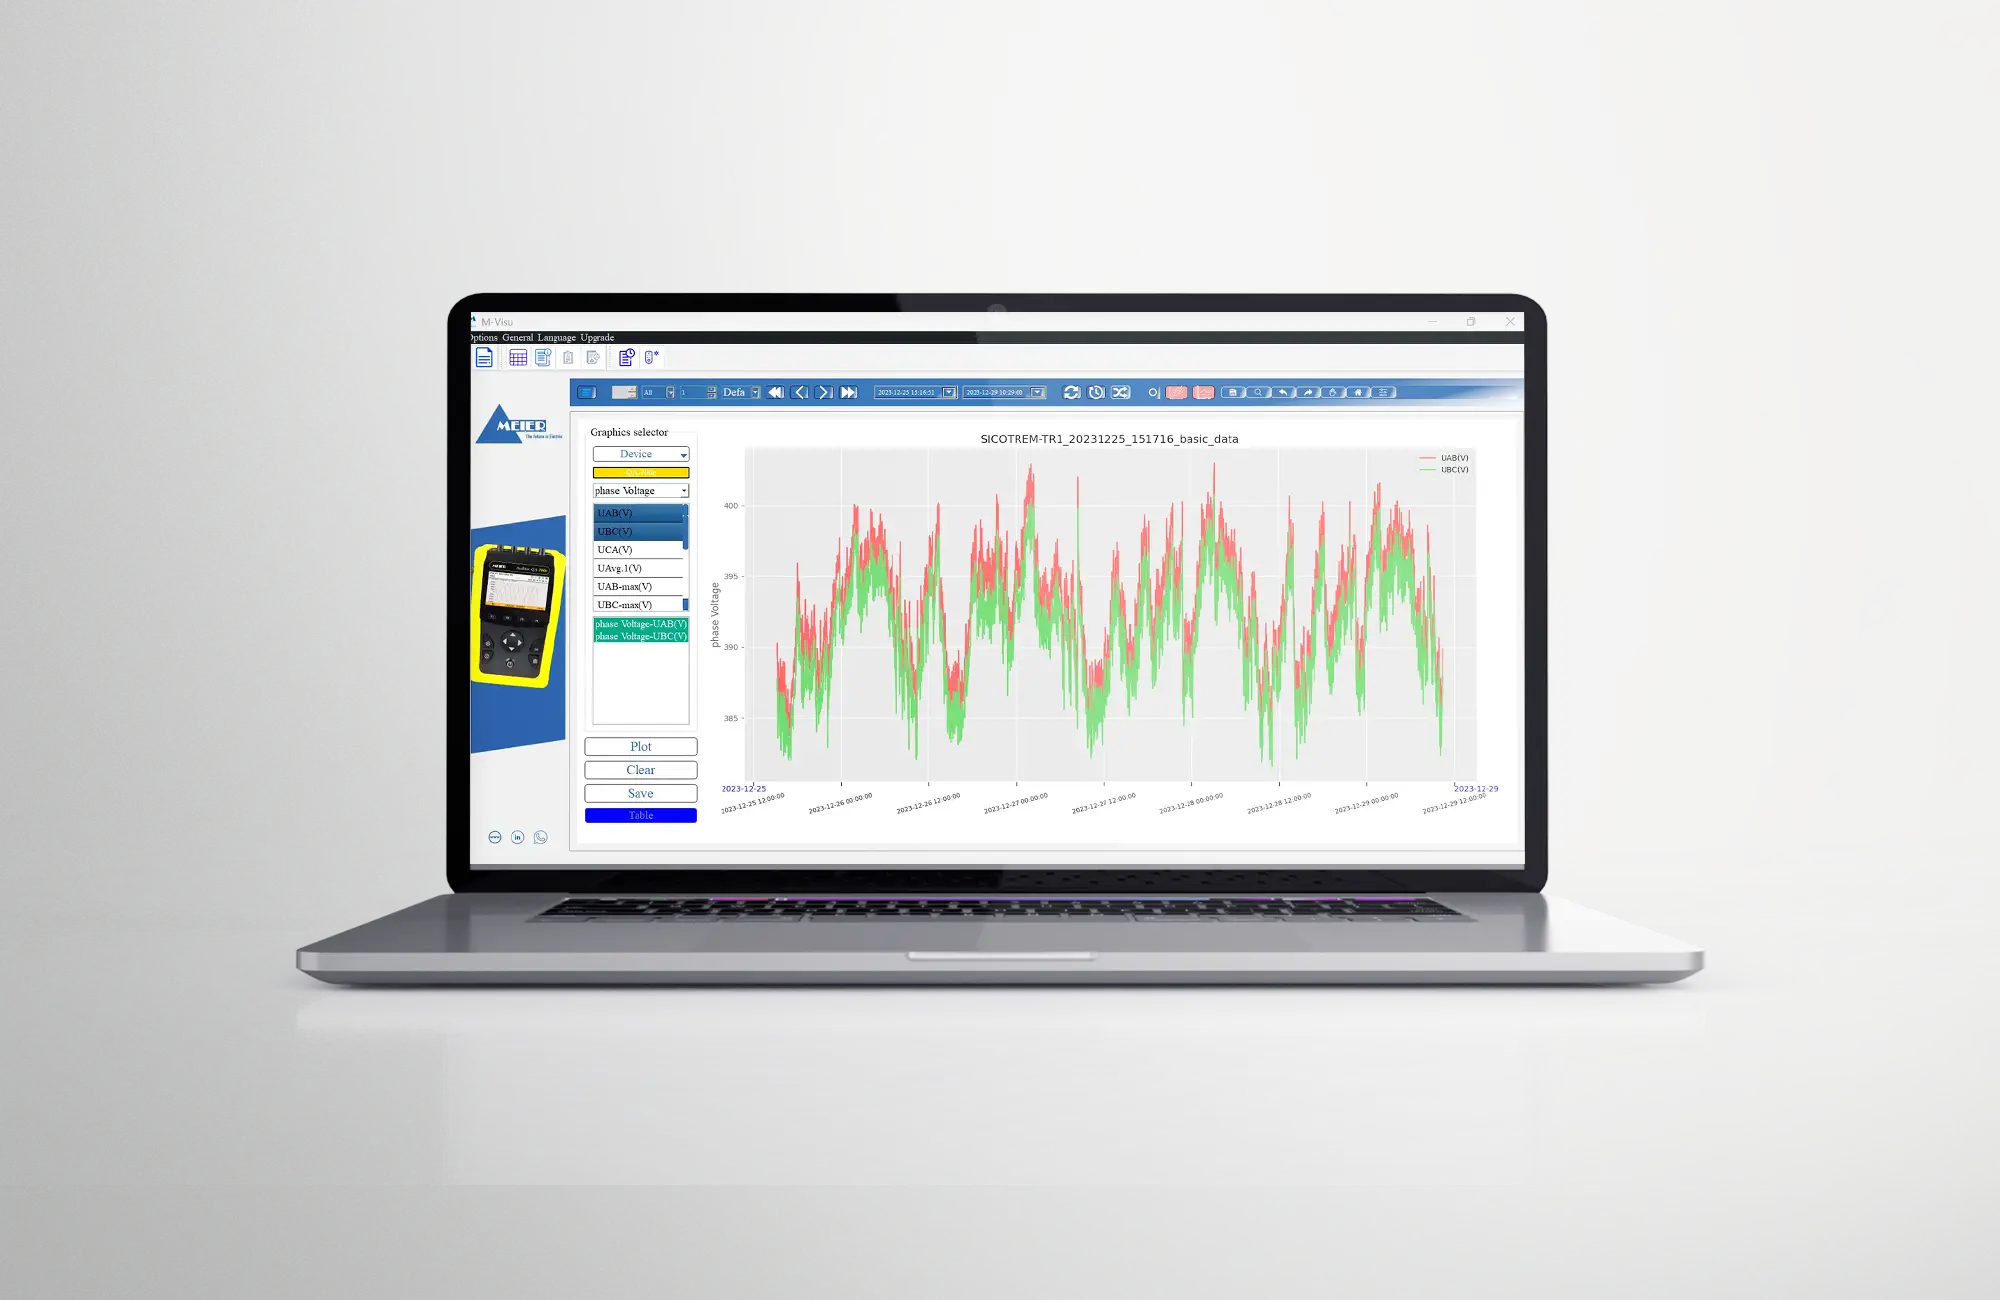
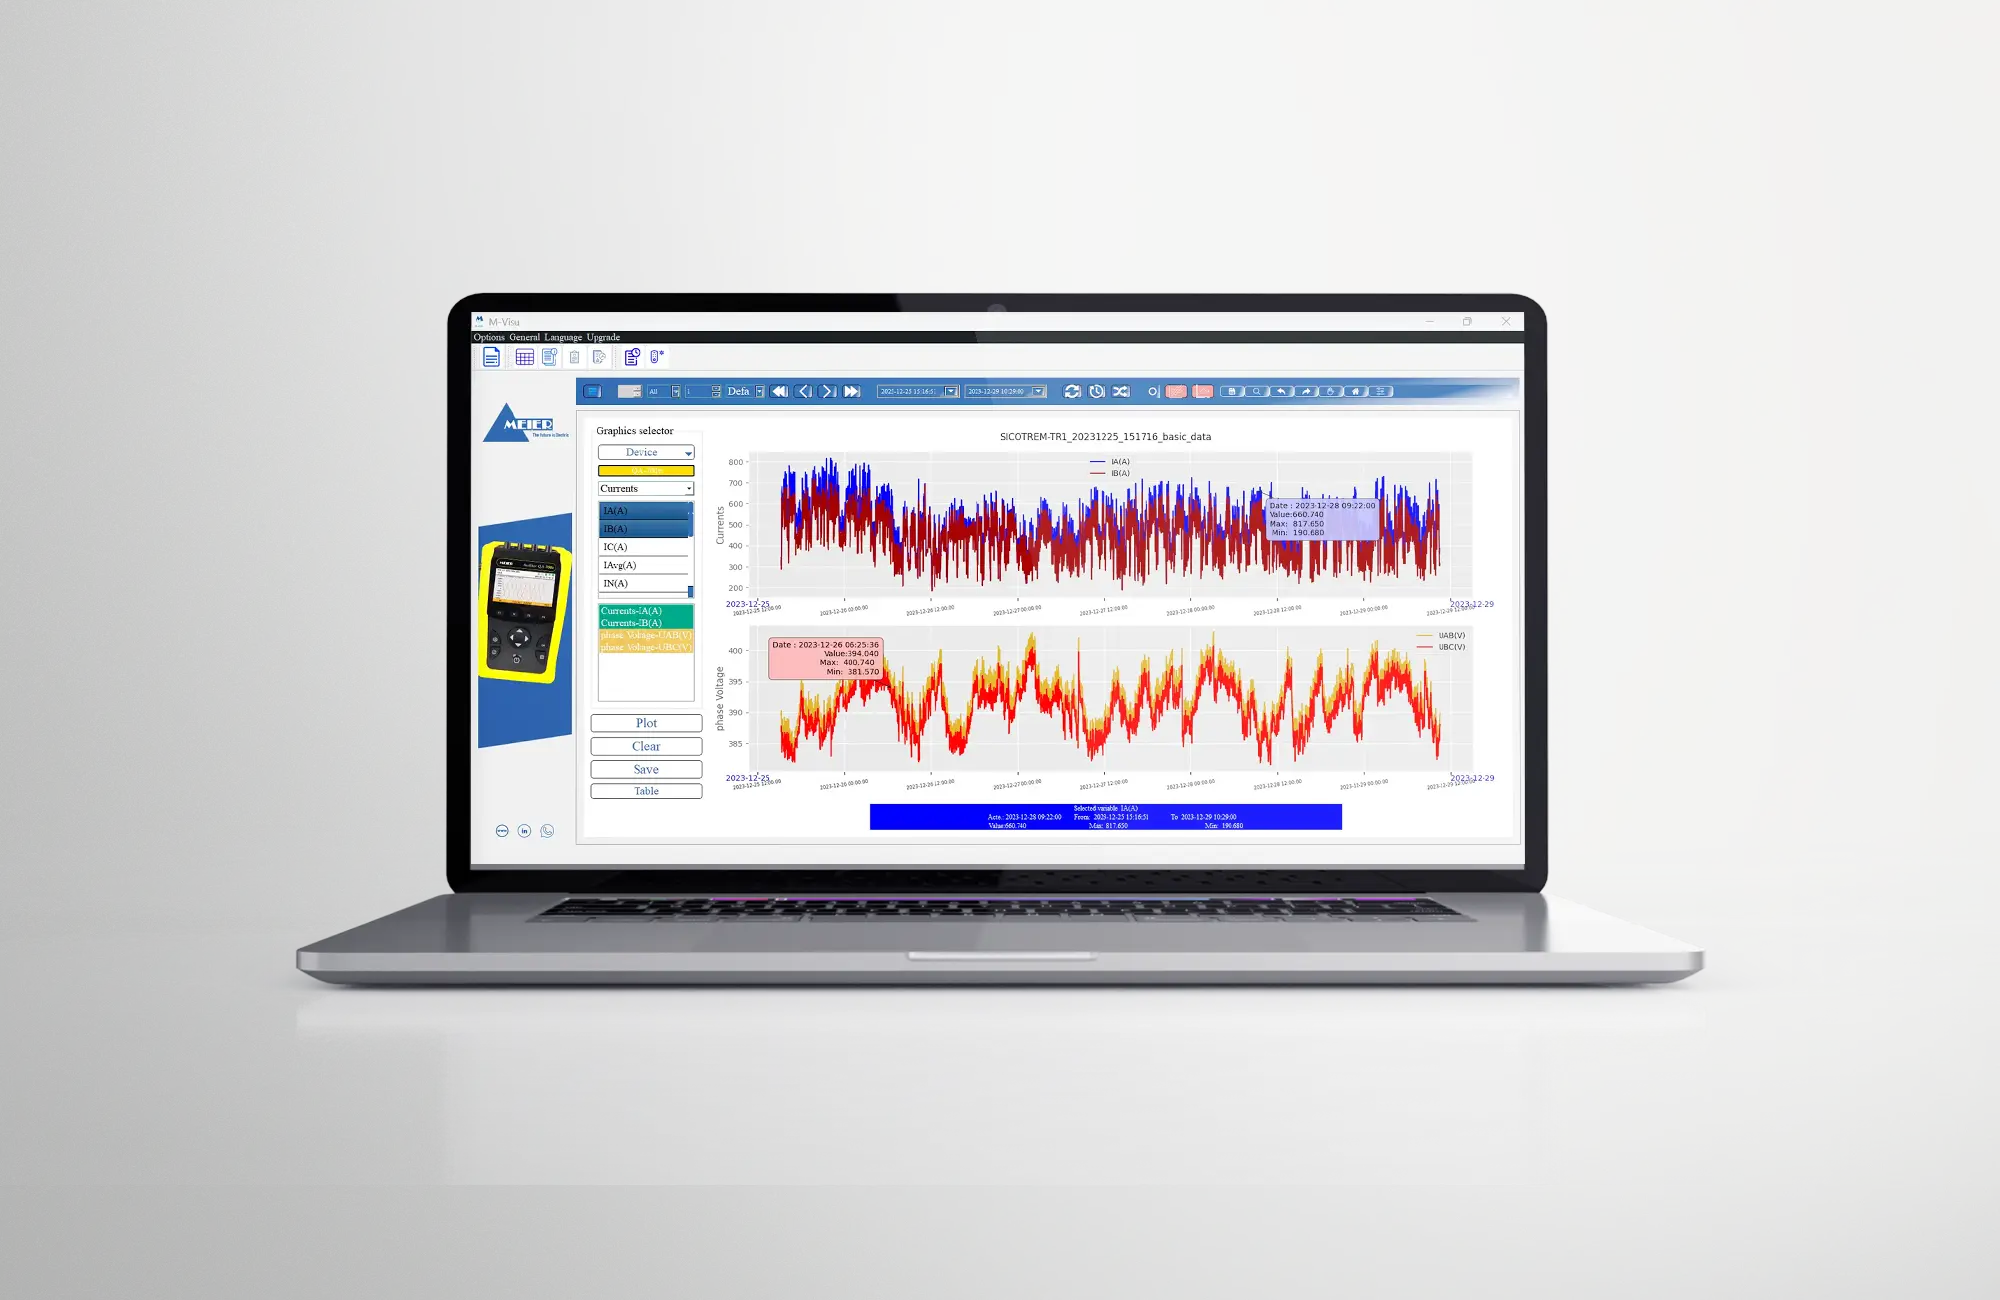
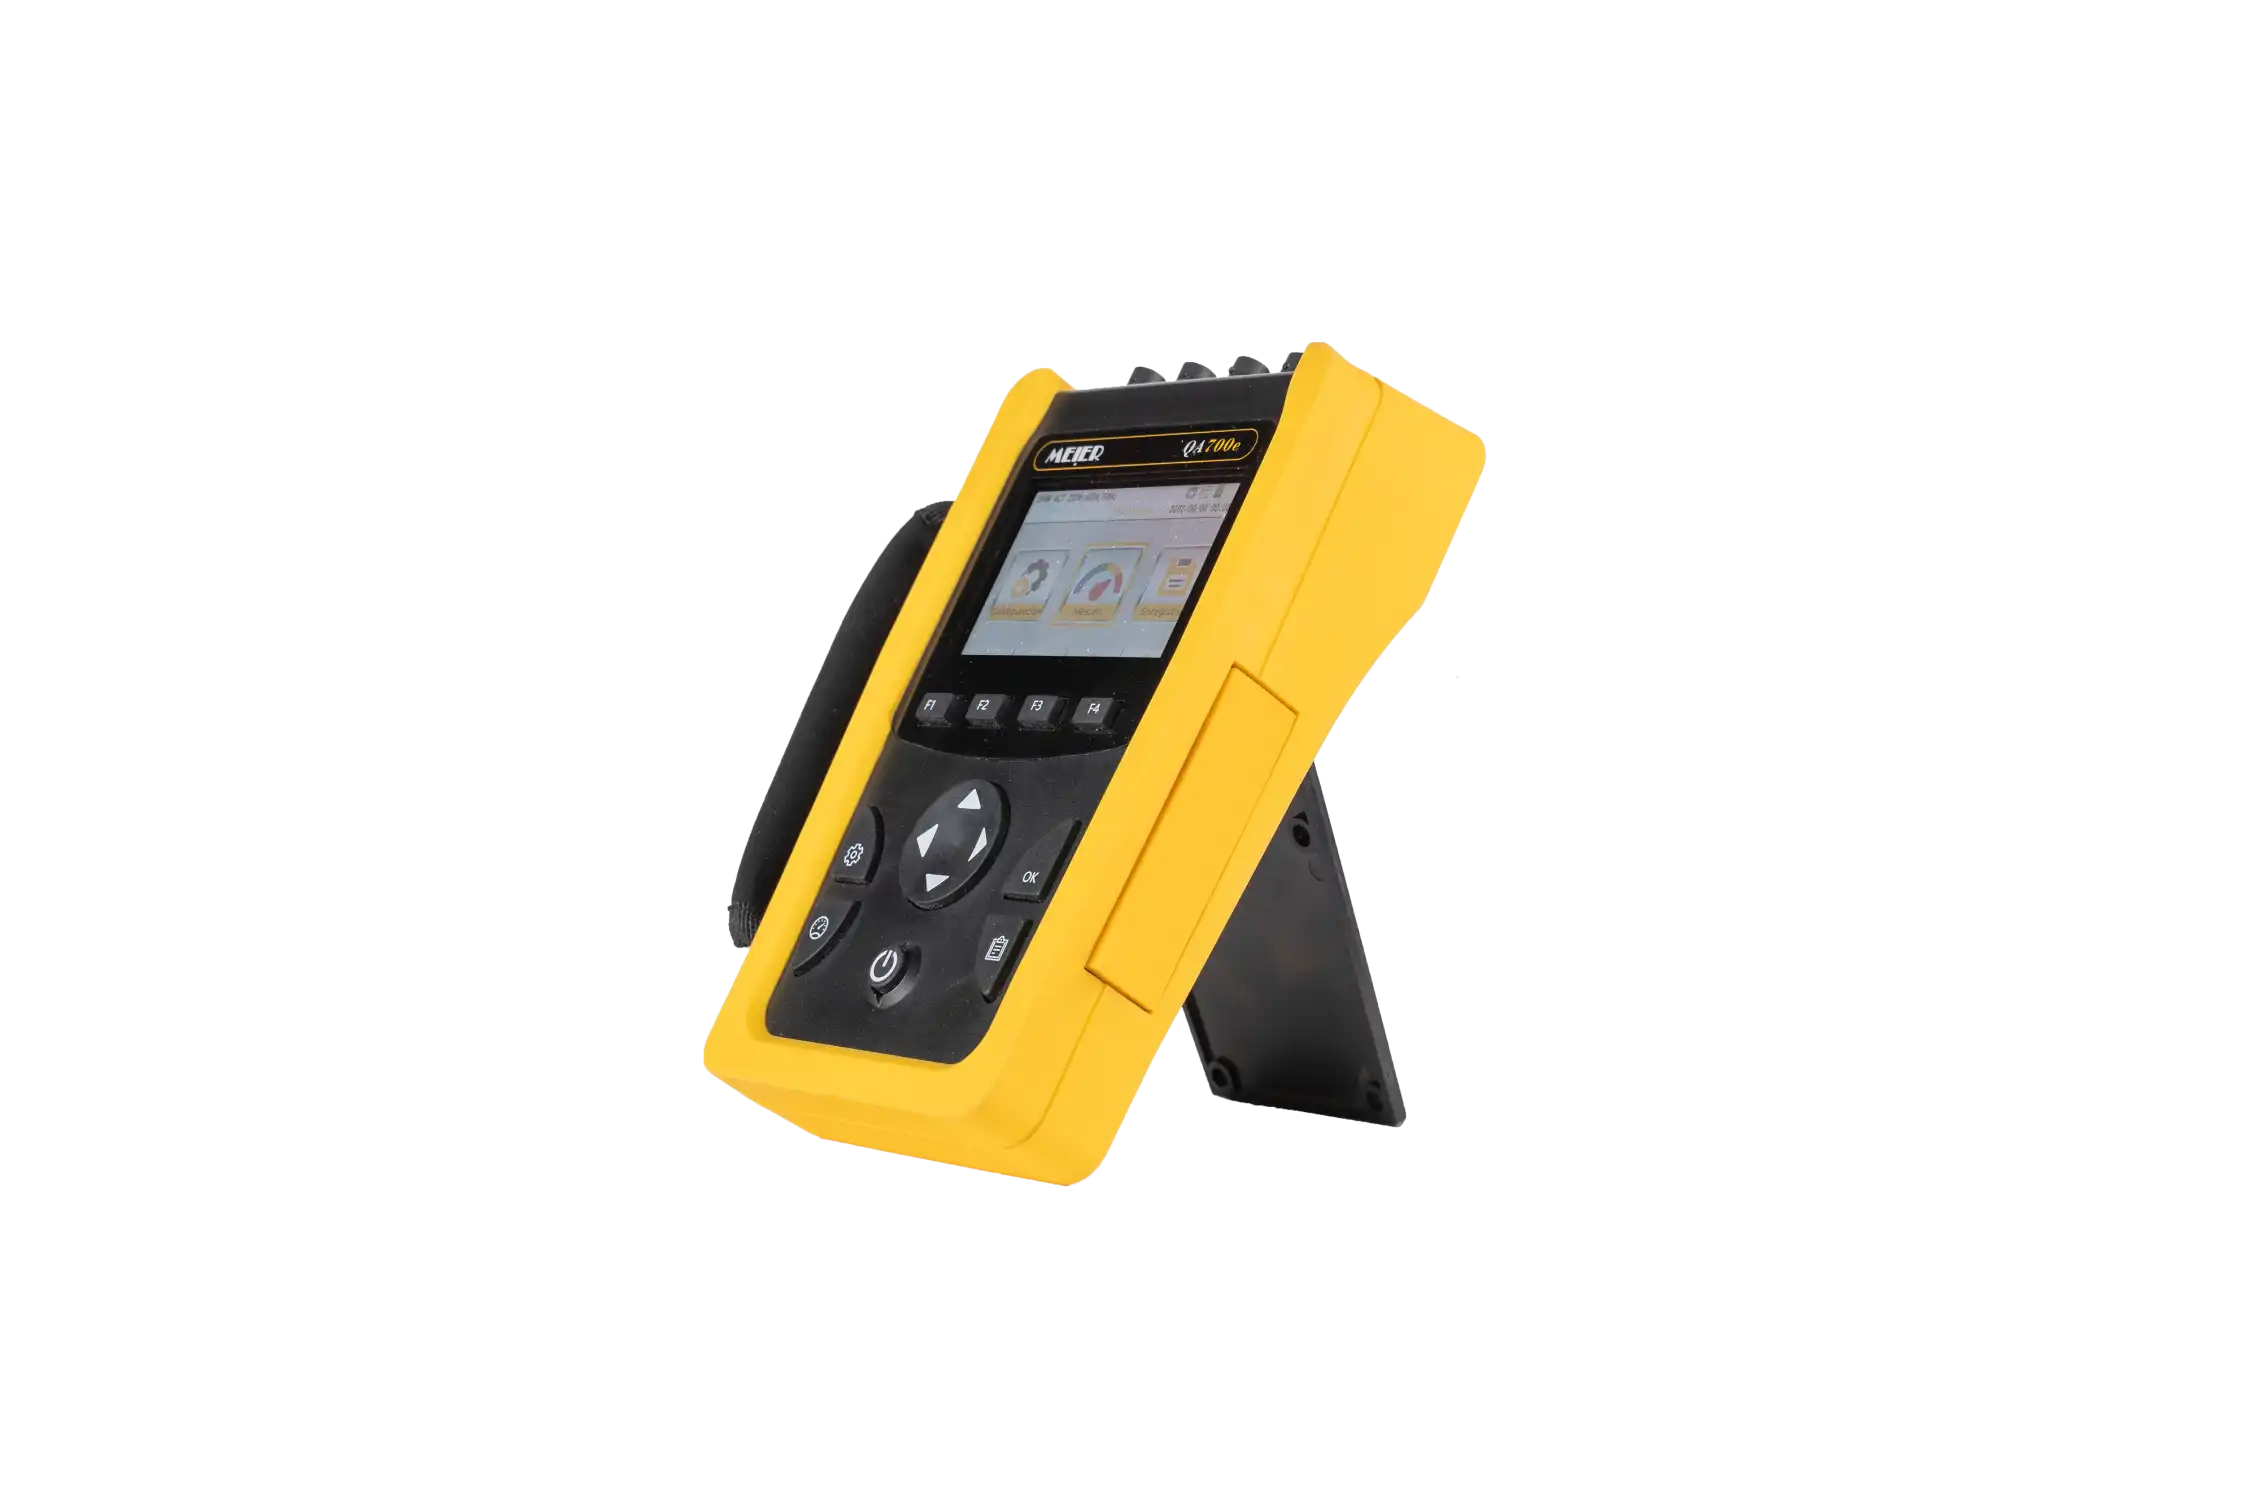
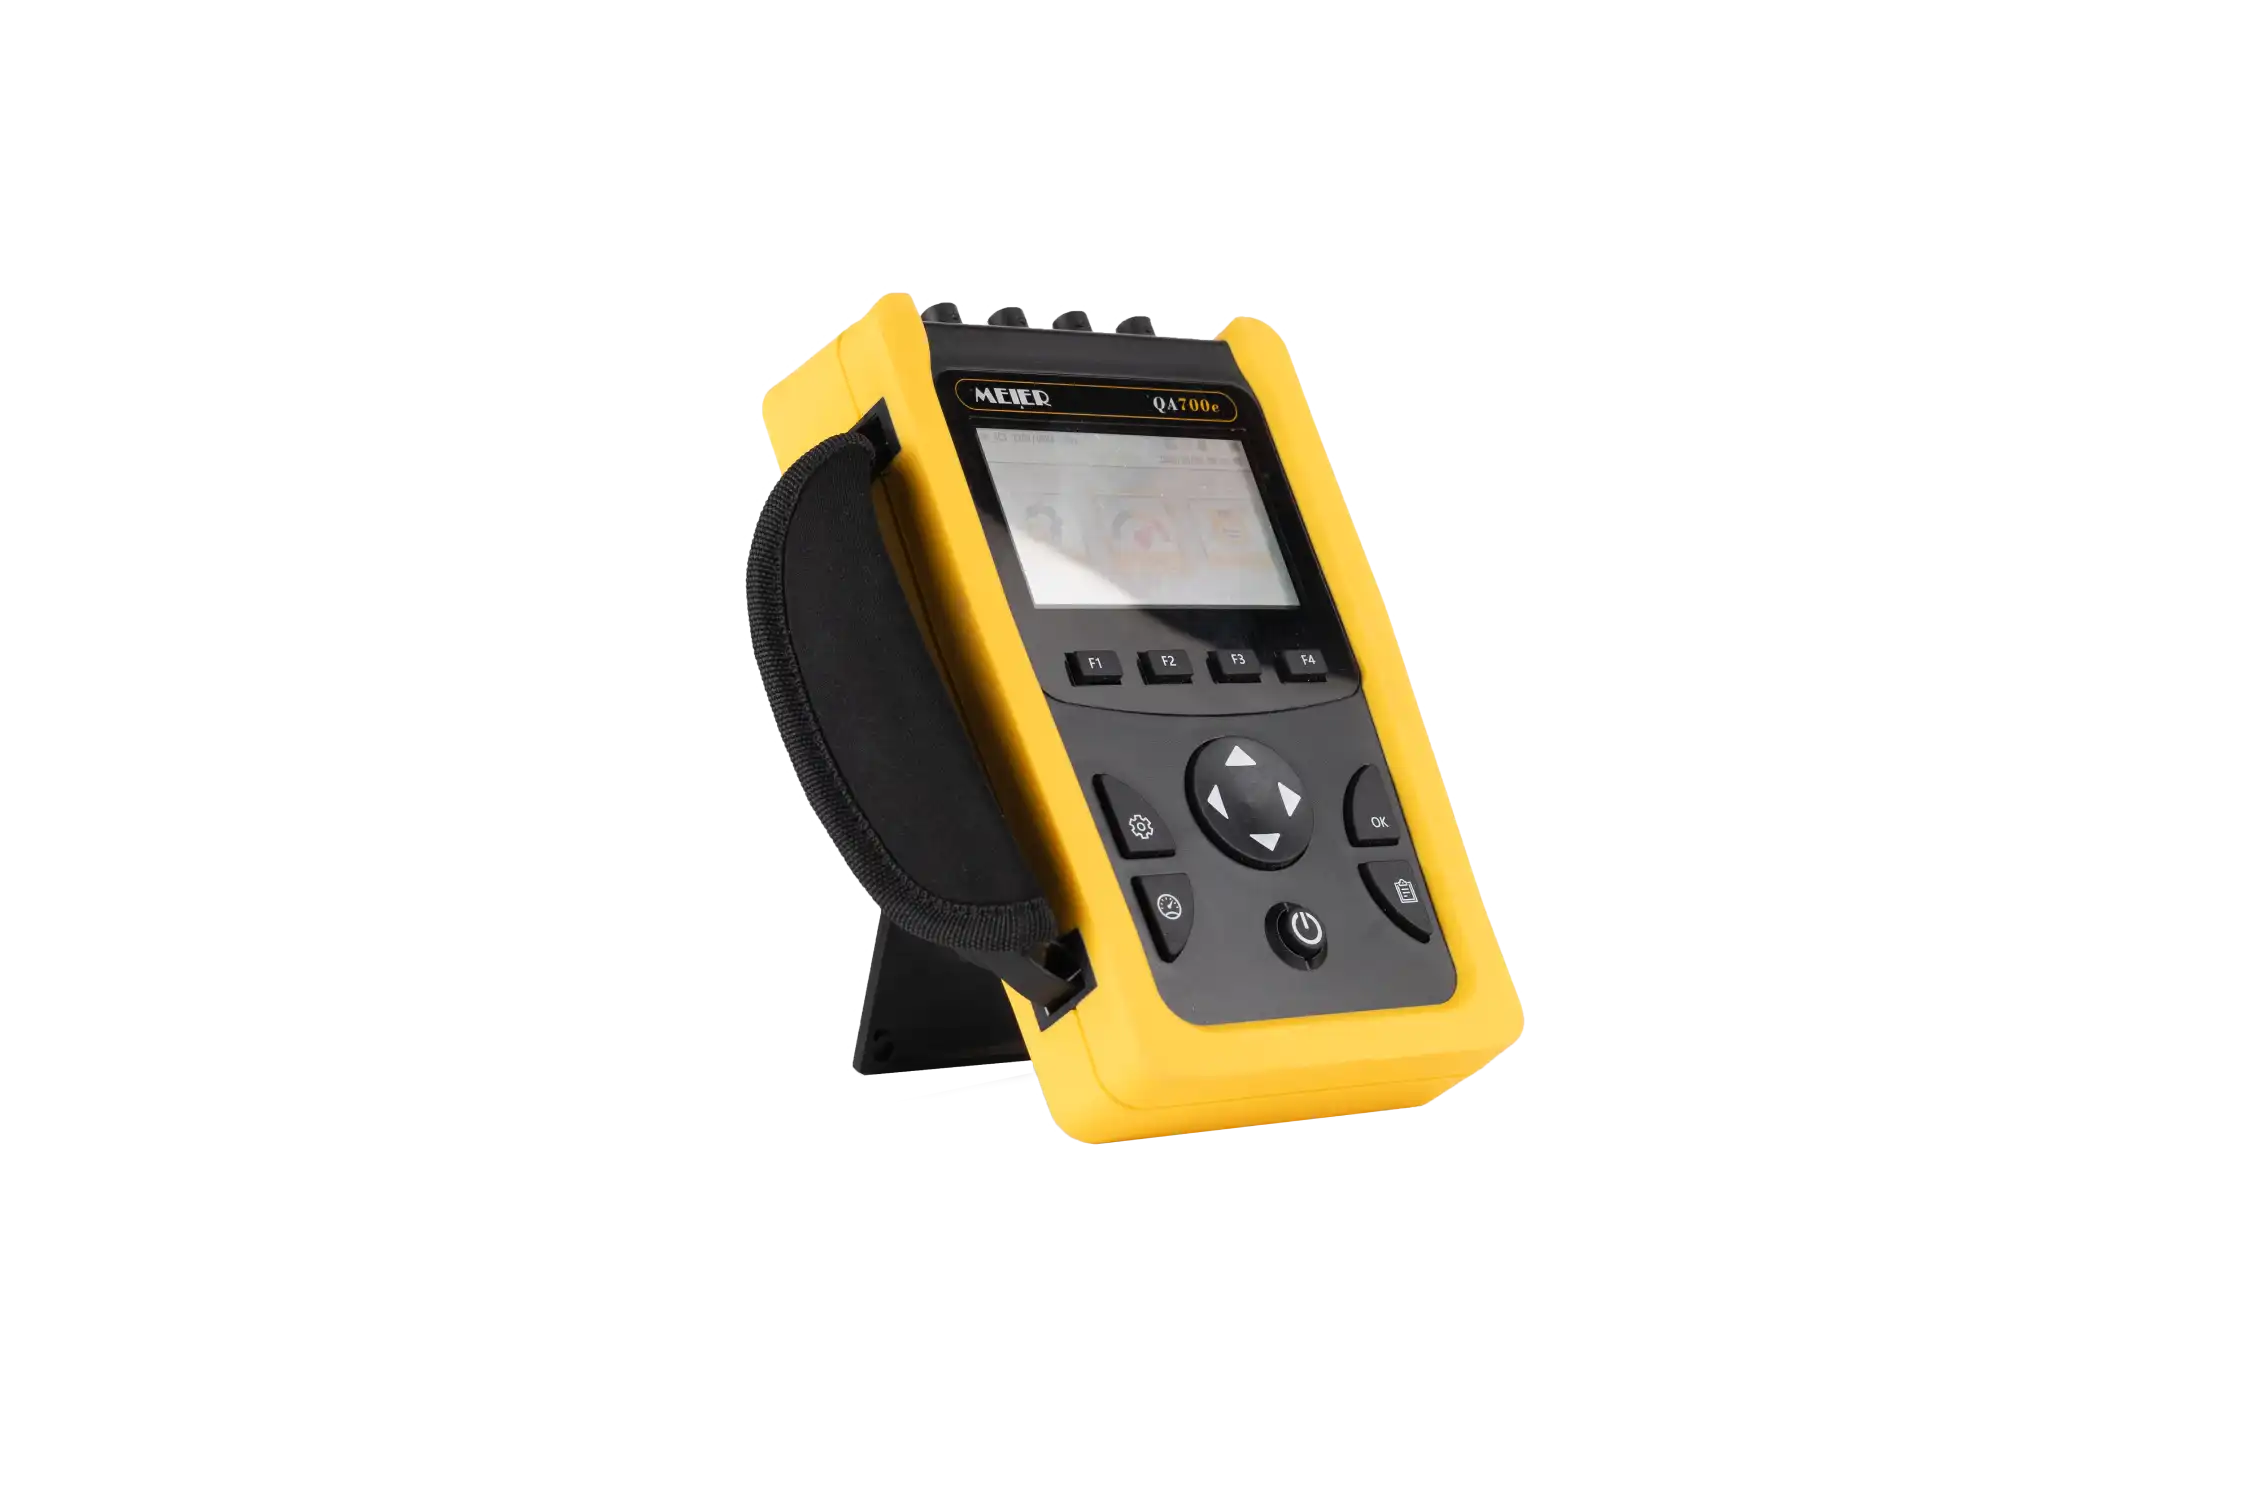
M-Visu is a powerful software package for analyzing and processing data recorded by Meier Energy measuring devices equipped with on-board memory, such as portable network analyzers, power meters with memory, weather stations, RTU, etc.
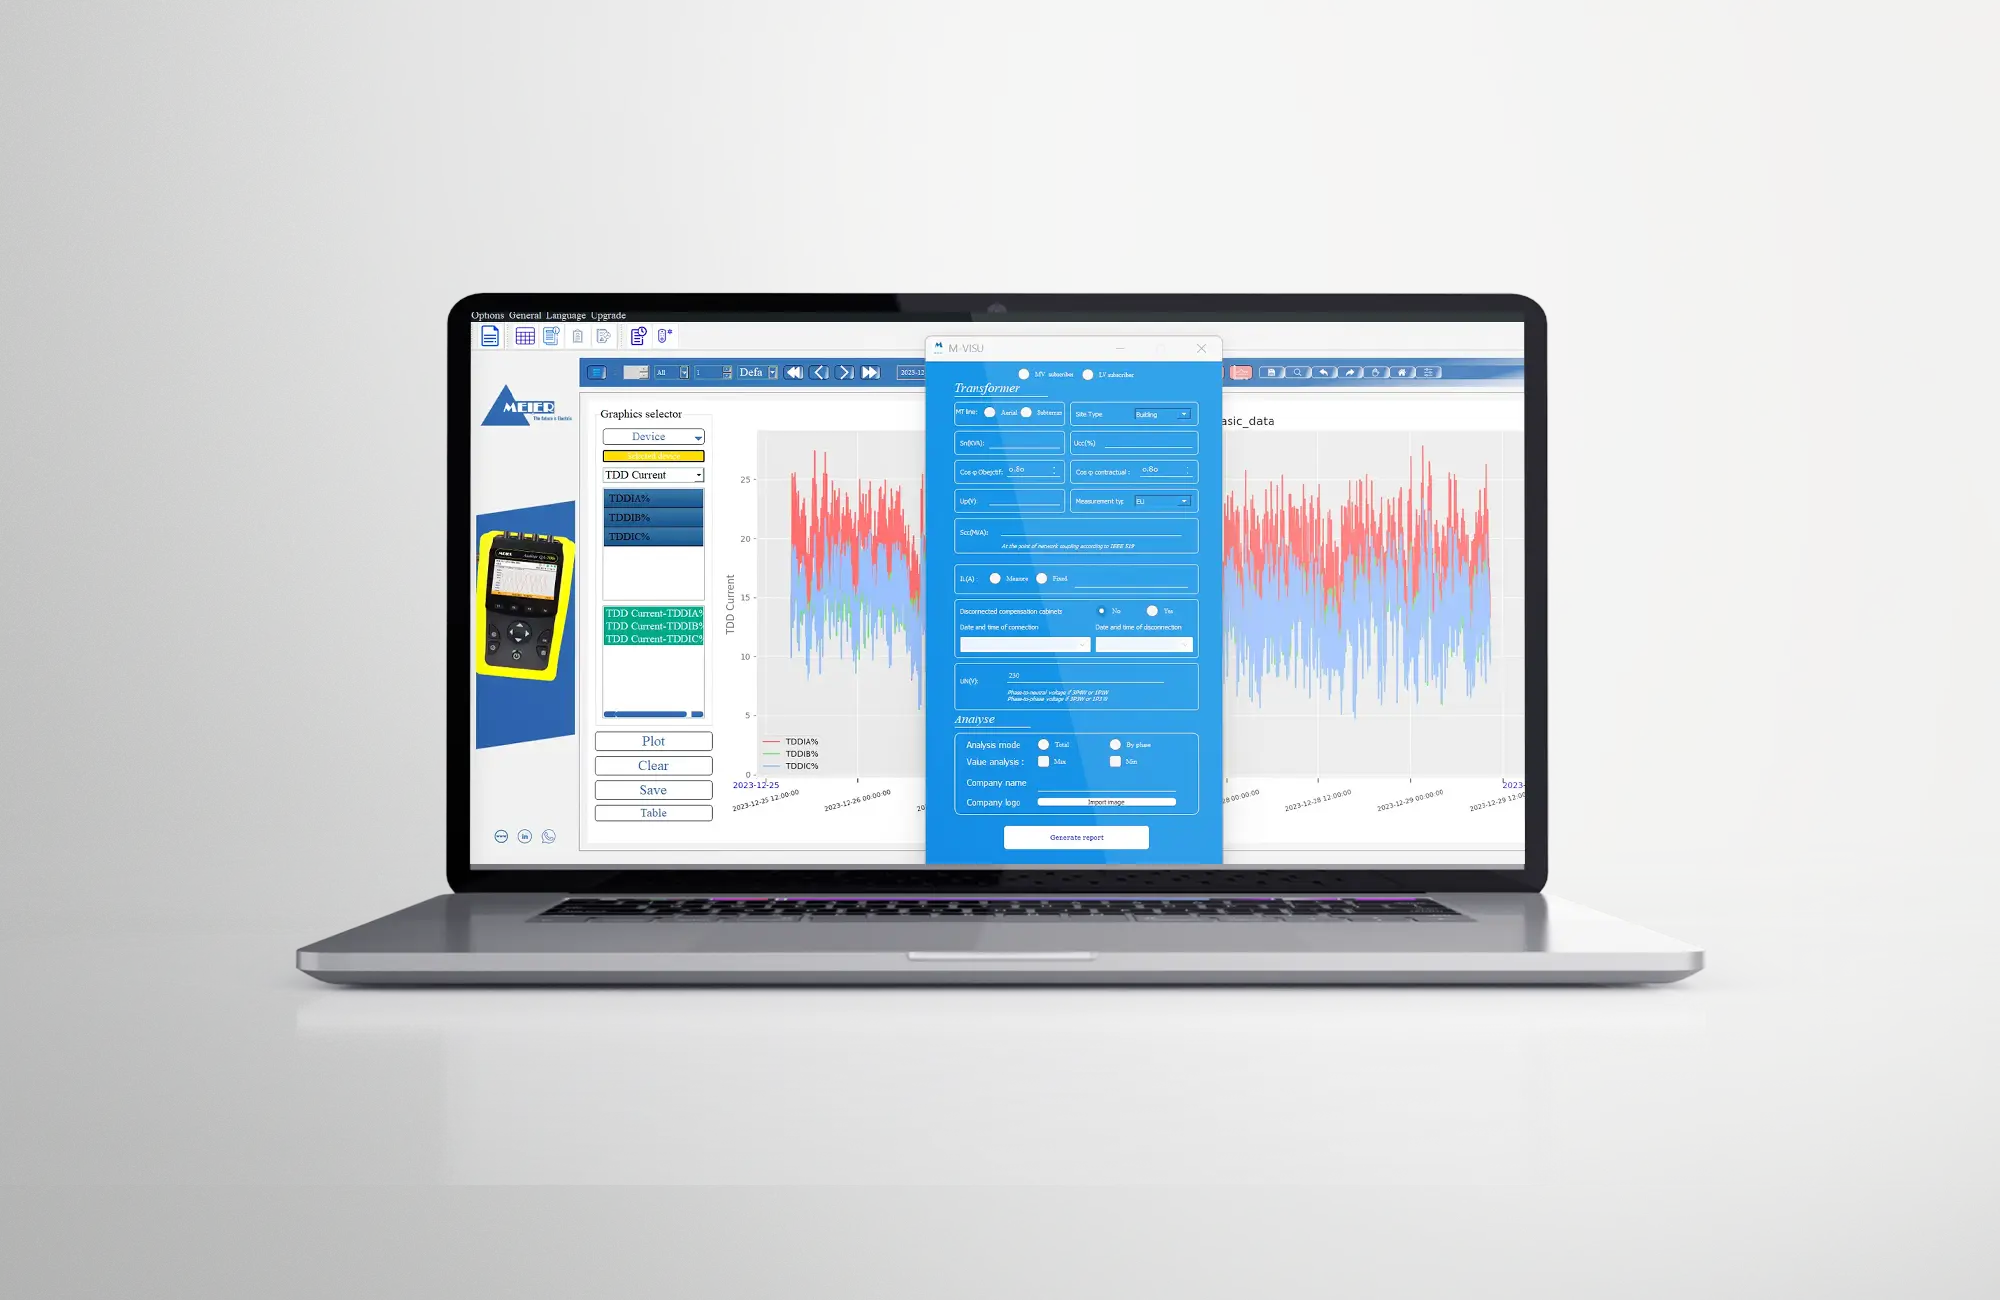
It allows precise visualization and analysis of recorded data, while offering advanced features such as automatic reporting.
M-Visu gives you the flexibility and data analysis capabilities you need to make better maintenance and facility management decisions. Indeed, thanks to its advanced statistical analysis tools, M-Visu allows you to quickly identify trends, correlations and anomalies in recorded data. This essential functionality allows, in the case of electrical network analyzers, to optimize network performance and efficiently resolve problems.
Characteristics
Product Videos
Installation & Activation of M-Visu
How to Import and View Data from QA700E Portable Analyzer on M-Visu
Harmonics Analysis with QA700E Portable Analyzer on M-Visu
Event Tracking with the QA700E Portable Analyzer on M-Visu
Automatic Report Generation with M-Visu
Product Resource
- M-Visu Software Download


